9 Amazon Data
9.1 Amazon Data Visualization
We have included plots for Amazon’s Twitter engagement, stock price, and a comparison of the two against one another. The first plot shows the change in engagement through the Twitter handle “@AmazonHelp”. The Twitter data is fairly consistent, hovering between 3000-4000 tweets per day. The only time this falters is during the last couple of days we collected data. This aligns with the stock price, as it gained momentum throughout the three weeks and ended with an over $400 gain over the course of our analysis. When compared by the rate of change, the last plot’s visualization shows noticeably similar trends between the Twitter engagement metrics and the stock price.
ggplot(filter(new_all_data, CompanyName=="Amazon"), aes(x = New_Date,y= Company_Date)) +
  geom_line(aes( color= CompanyName), lty = 1, size = 2) +
  geom_hline(yintercept = 0, size = 1, color="#333333") +
  xlim(x= c(Sys.Date()-23, NA))+
    theme(legend.title=element_blank())+
  labs(title="Amazon Twitter Data", x= "Date", y= "Number of Tweets")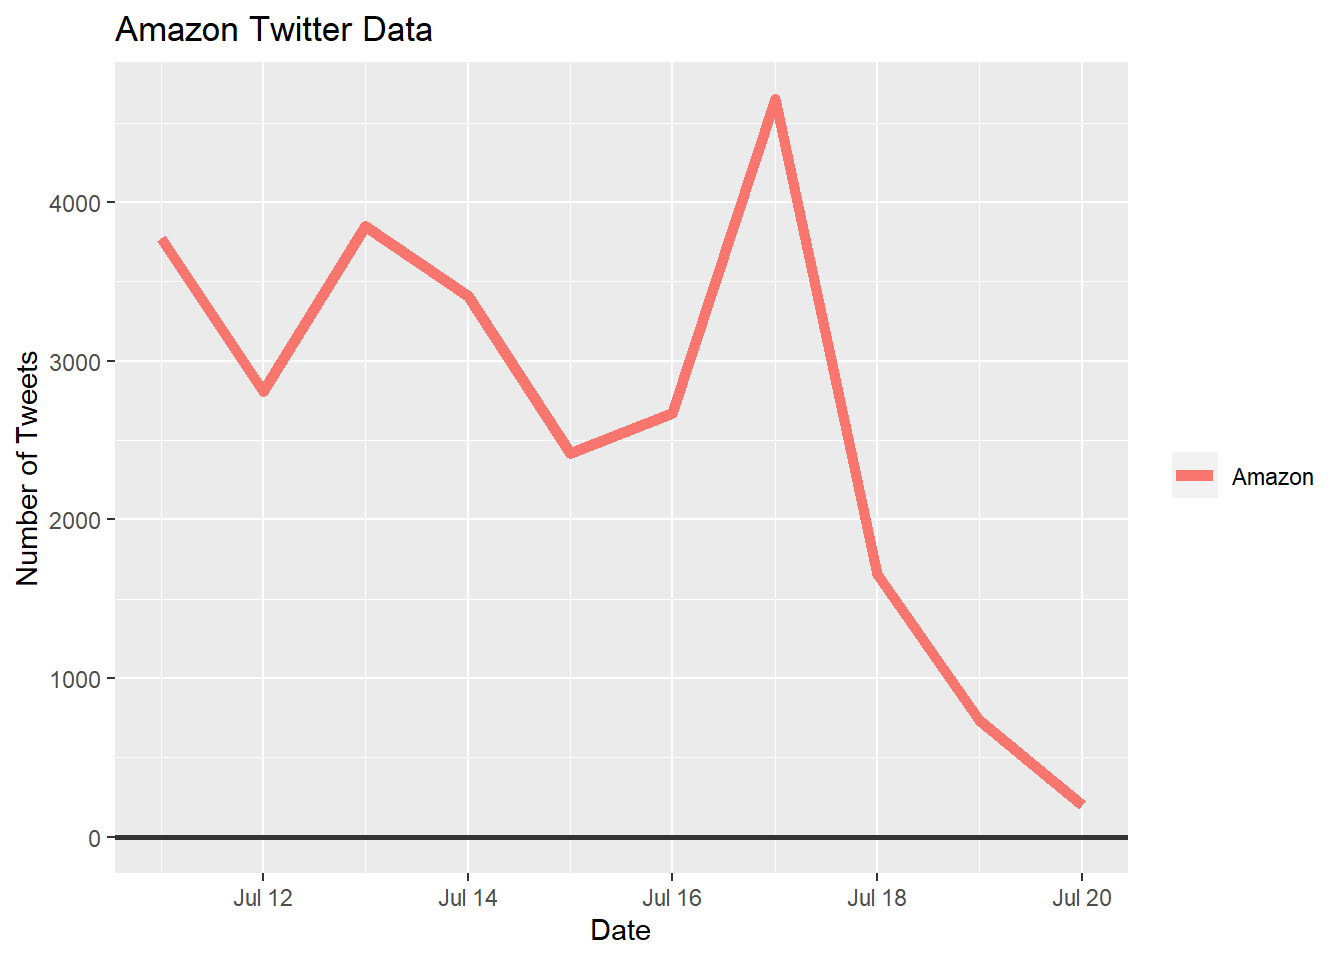
ggplot(filter(companystock, Company=="Amazon"), aes(x = StockDate,y= Price)) +
  geom_line(aes( color= Company), lty = 1, size = 2) +
  geom_hline(yintercept = 2700, size = 1, color="#333333") +
  scale_colour_manual(values = c(Amazon="#00BFC4"))+
    theme(legend.title=element_blank())+
  labs(title="Amazon Stock Data", x= "Date", y= "Price of Stock ($)")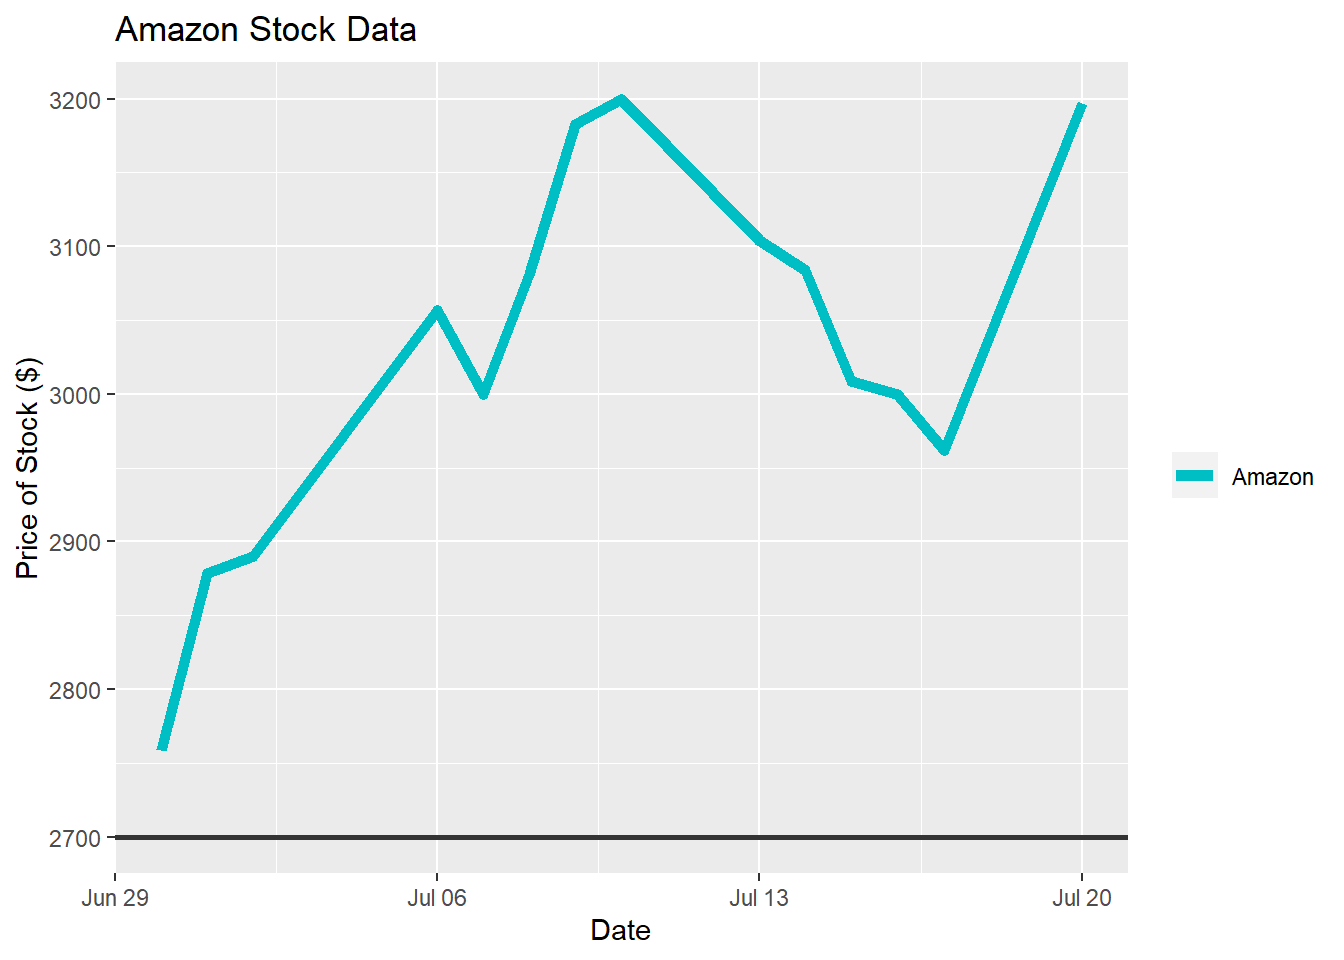
ggplot(filter(companystock, Company=="Amazon"))+
  geom_line(aes(x= StockDate, y= scale(Price), color = "Stock Price"), lty = 1, size = 2)+
  geom_line(aes(x= StockDate, y= scale(Tweets), color = "Number of Tweets"), lty = 1, size = 2)+
    theme(legend.title=element_blank())+
  labs(title="Amazon Stock and Twitter Data Comparison", y= "Rate of Change", x= "Date")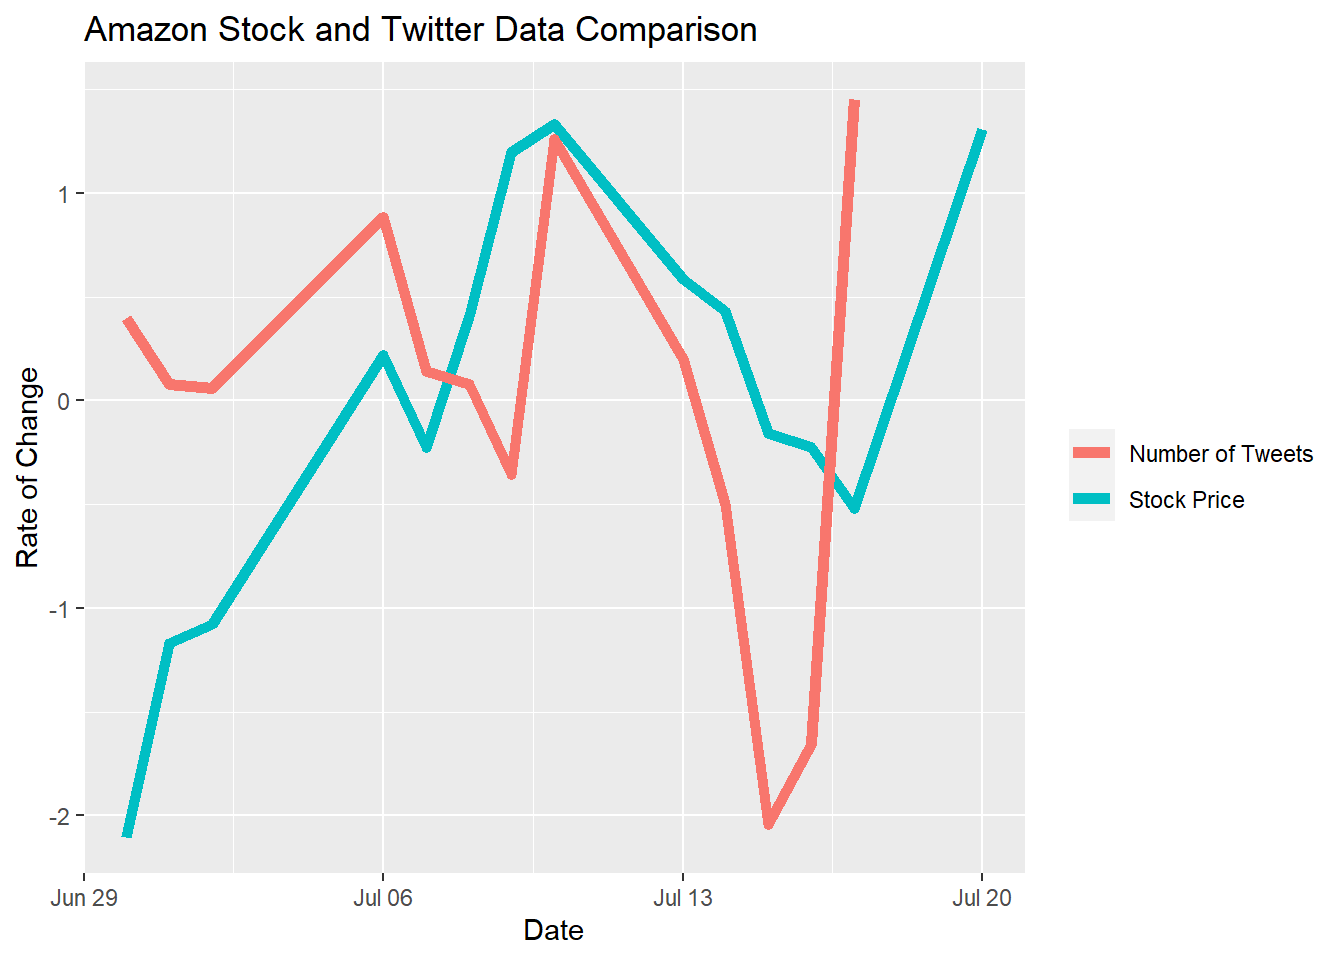
9.2 Amazon Conclusion
Amazon’s data shows a particularly explicit trend between Twitter engagement and stock price. When looking at the comparison plot of the two, the rate of change is almost exactly the same in some instances with little difference throughout the three weeks we collected data. If you look at the Twitter plot, you can see a steep drop towards the end of our collection period. While this drop aligns with the stock price, it is difficult to pinpoint exactly why there’s an abrupt drop in Twitter engagement on their support Twitter handle. This drop is even more noticeable when looking at the Twitter data of all three companies measured in terms of rate of change. A reasonable and quite possible assumption for this significant drop could be due to the work of “FC Ambassadors”. These Amazon employees are tasked with patrolling Amazon’s Twitter handles at all times. There has been criticism regarding Amazon’s role in their social media presence, which could be a reason why we see the data drop. The Twitter engagement we saw for Amazon towards the end of the collection period was very similar to Dell and Microsoft, which leads us to believe that the numbers are more representative of an authentic customer satisfaction rate compared to the numbers at the beginning of the collection period.